|

Photo by Brataffe, CC BY-SA 4.0 , via Wikimedia Commons.
Quantifying greenhouse gas emissions from global aquaculture
 (UNITED STATES, 2/24/2021)
The following is an excerpt from an article published by the Global Aquaculture Advocate:
Results show modest low emission intensity of aquaculture relative to terrestrial livestock
The aquaculture industry provides an important contribution to global food security directly (by increasing food availability and accessibility) and indirectly (as a driver of economic development). Importantly, fish are rich in protein and contain essential micronutrients which cannot easily be substituted by other food commodities.
One of the current, key environmental (and social) concerns is climate change, more specifically the greenhouse gas (GHG) emissions that arise along food supply chains. To enable sustainable expansion of aquaculture, we need to understand aquaculture’s contribution to global GHG emissions and how they can be mitigated.
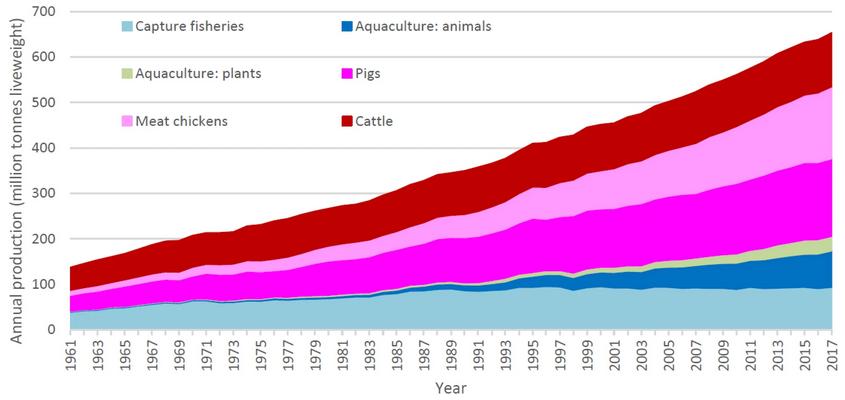
World production of capture fisheries, aquaculture and pig, chicken and cattle meat from 1961 to 2017. Data sources (Click to enlarge)
This article – adapted and summarized from the original publication [MacLeod, M.J., Hasan, M.R., Robb, D.H.F. et al. Quantifying greenhouse gas emissions from global aquaculture. Sci Rep 10, 11679 (2020)] – reports on a study where we quantified the GHG emissions arising from the culture of the main aquatic animals reared for human consumption, i.e., bivalves, shrimps/prawns and finfish (catfish, cyprinids, Indian major carps, salmonids and tilapias). The method quantifies the main GHG emissions arising “cradle to farm-gate” from the following activities: the production of aquafeed raw materials; processing and transport of feed materials; production of compound feed in feed mills and transport to the fish farm; aquaculture of organisms.
We also compared these estimates of global aquaculture emissions to other livestock sectors, and calculated the emissions intensity (i.e., the kg of GHG emissions per unit of edible output) of aquaculture and explain the factors that influence it. Recent commercial feed formulations were used for the main species groups and geographic regions, thereby providing a more up to date and detailed analysis than is generally provided in academic literature.
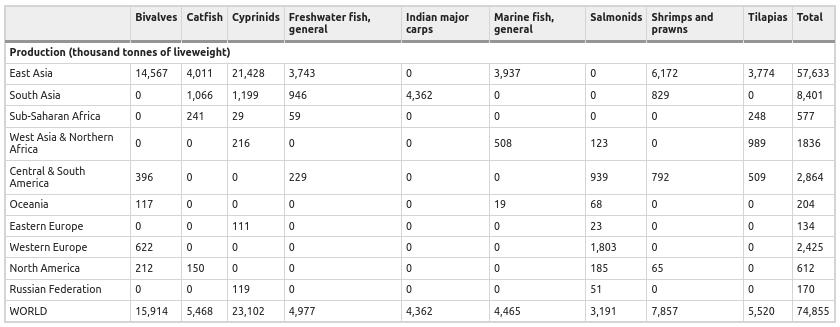
Table 1 Production of different culture groups by region, 2017 (Click to enlarge)
STUDY SETUP
Global aquaculture is a complex sector consisting of many different species reared in a variety of systems and environments. To manage this complexity in the study, our analysis focused on the main cultured aquatic animal species groups (aquatic plants are excluded), i.e., bivalves, catfish, cyprinids, freshwater fish (general), Indian major carps, marine fish (general), salmonids, shrimps and prawns and tilapias.
The main species groups were identified by extracting production data from the Food and Agriculture Organization of the United Nations (FAO), listing the species groups within each geographical region (according to FAO definitions) in order of production amount, then selecting the groups until they accounted for >90 percent of the production within the region (>85 percent in Eastern Europe). This approach captured an estimated 93 percent of global production. Carbon sequestration in pond sediments is not included in this study.
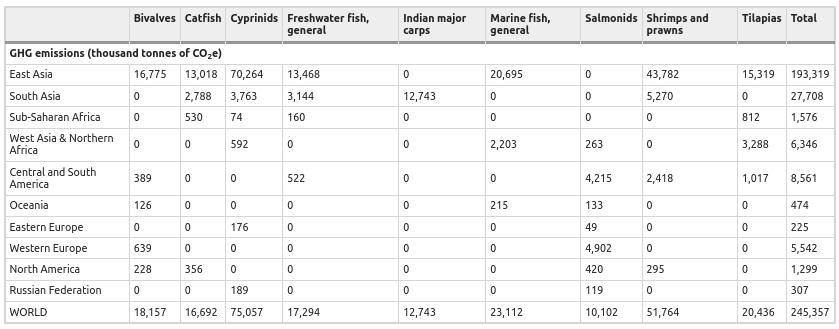
Table 2 GHG emissions by culture group and region, 2017, calculated in this study (Click to enlarge)
For detailed information on the data and GHG categories included in the calculations; emission factors used for feed raw materials and fertilizers; feed conversion ratios and ration composition; total production by species-group and regions; on-farm energy use and other data; and calculations used, refer to the original publication.
RESULTS AND DISCUSSION
We calculated the GHG emissions for the year 2017 for the nine major aquaculture culture groups (which accounted for 93 percent of global aquaculture production). The total GHG emissions for this 93 percent were 245 million tons of CO2e [carbon dioxide, CO2, equivalent or CO2e refers to CO2 emissions (metric tons) with the same global warming potential as one metric ton of another greenhouse gas – it is a standard unit for measuring carbon footprint].
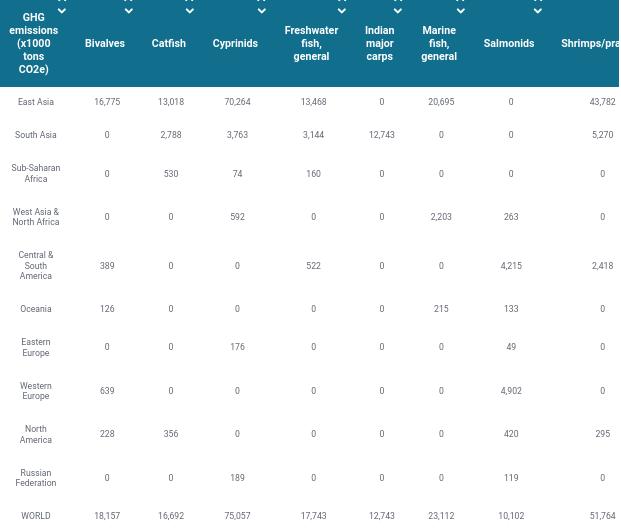
Table 1. GHG emissions by culture group and region, 2017, calculated in this study. Modified from original.(please read the full article to see the table activate)
Assuming that the remaining 7 percent of production had the same emissions intensity (EI), the total emissions in 2017 for all shellfish and finfish aquaculture would have been 263 million tons of CO2e (Table 1). The United Nations Environmental Programme, UNEP estimated total anthropogenic emissions to be 53.5 gigatons, Gt [1 billion tons], of CO2eq/year in 2017, so the culture of aquatic animals represented approximately 0.49 percent of the total anthropogenic [caused by human action or inaction] emissions.(continued...)
Authors:Michael J. MacLeod, Ph.D. Mohammad R. Hasan, Ph.D. David H.F. Robb Mohammad Mamun-Ur-Rashid / Global Aquaculture Alliance - Read the full article here
[email protected]
www.seafood.media
Information of the company:
|
Address:
|
85 New Hampshire Avenue, Suite 200
|
|
City:
|
Portsmouth
|
|
State/ZIP:
|
New Hampshire (NH 03801)
|
|
Country:
|
United States
|
|
Phone:
|
+1 603-317-5000
|
|
E-Mail:
|
[email protected]
|
|
Skype:
|
https://www.instagram.com/seafoodalliance/
|
More about: 
|
|
|
|


.jpg)
.jpg)
.jpg)


 Print
Print