|
Russia Dominates the Raw Material Supply Chain
Global Pollock Surge Drives Chinese Seafood Imports to New Heights
 CHINA
CHINA
Tuesday, May 26, 2026, 00:20 (GMT + 9)
Surging demand for raw materials fuels record-breaking trade volumes as prices climb across major processing hubs
A massive influx of seafood has hit the market as China imported 146,519 tons of pollock products in April 2026 , commanding a total value of US$279 million . According to market data reported by Food World (Beijing) , the relentless demand has driven the average import price of frozen raw materials up to US$1.87 per kilogram . Frozen Alaskan pollock continues to anchor the trade, accounting for 139,897 tons and US$261 million of the total shipments, representing a staggering 95% share of the monthly import volume.
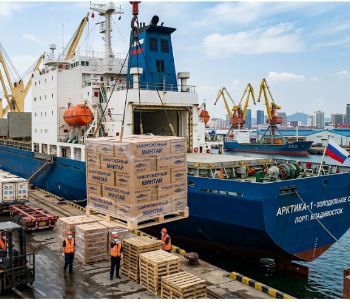
Russia Dominates the Raw Material Supply Chain
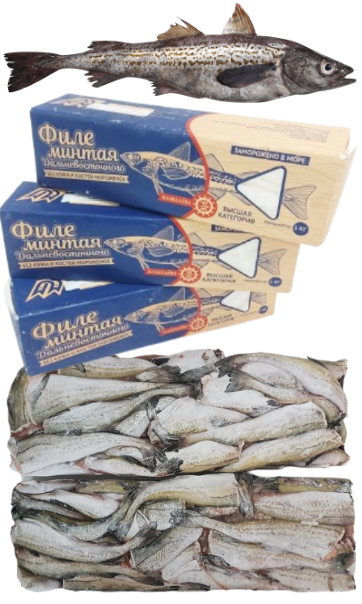 The trade structure remains heavily weighted toward Head and Gut ( H&G ) raw materials rather than processed options. Out of the 139,897 tons of frozen Alaskan pollock brought in, Russia emerged as the undisputed leader, supplying 135,632 tons of feedstock valued at US$253 million . This single-source dominance represents 96.9% of the entire raw material category. The trade structure remains heavily weighted toward Head and Gut ( H&G ) raw materials rather than processed options. Out of the 139,897 tons of frozen Alaskan pollock brought in, Russia emerged as the undisputed leader, supplying 135,632 tons of feedstock valued at US$253 million . This single-source dominance represents 96.9% of the entire raw material category.
By contrast, the United States provided 5,989 tons worth US$5.54 million , while South Korea contributed 908 tons . Industry experts note that while South Korea appears in the data, its volume consists largely of re-export and transit logistics, confirming that global pollock supply remains tightly consolidated between Russia and the United States .
Processed Fillets and Fish Meat Fetch Premium Prices
While raw fish dominates the volume, processed segments command significantly higher prices in the marketplace.
-
Fish Fillets: Total imports reached 4,952 tons ( US$13.05 million ), with Russia supplying 4,141 tons ( 83.6% ) and the United States providing 456 tons . The average price reached US$2.64 per kilogram .
-
Fish Meat: Shipments totaled 1,670 tons ( US$5.07 million ), with Russia sending 923 tons and the United States contributing 456 tons . The average price soared to US$3.04 per kilogram .
Value Insight: The data reveals sharp pricing disparities depending on the origin of the seafood. In April , premium US pollock products averaged US$2.45 per kilogram , outpacing Russia's average of US$1.89 per kilogram , while South Korean transit products lagged at US$1.33 per kilogram .
Shandong Province Solidifies Role as Seafood Processing Hub
On the regional front, Shandong continues to act as the primary gateway for seafood processing. The province imported 93,576 tons of pollock products valued at US$169 million , capturing more than 63% of the national volume. Liaoning followed closely with 51,832 tons ( US$109 million ), while Jilin brought in 51,056 tons ( US$105 million ).
.jpg)
Photo: Stockfile / FIS
Shandong also absorbed the vast majority of processed fillets, taking in 4,093 tons ( 82.7% of the national total), while Liaoning took 561 tons and Shanghai imported 191 tons . However, Liaoning Province inverted the trend for specialized fish meat products, securing 1,405 tons to claim an 84% national market share, leaving minor volumes to Shandong , Jiangsu , Shanghai , and Beijing .
Bonded Logistics Keep Supply Chains Moving
Customs data indicates that logistics and processing frameworks dictate how these goods enter the country. Bonded circulation remains the preferred pathway, with "goods entering and leaving bonded supervision sites" hitting 76,787 tons , or 52.4% of national imports.
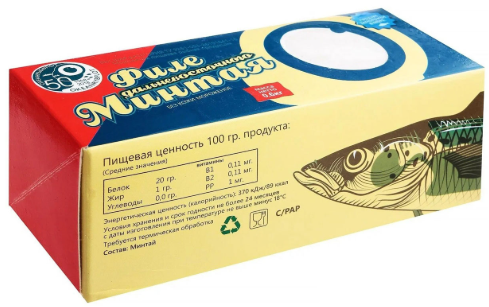
China import from Russian Pollock H&G, Fillet, Minced and surimi
Traditional processing trade accounted for 43,046 tons , and logistics goods in special customs supervision zones made up 26,136 tons . Meanwhile, general trade routes accounted for a mere 2,162 tons with an import value of US$5.69 million , highlighting how heavily this multi-million dollar seafood pipeline relies on specialized trade zones.
🇯🇵 Japanese
グローバルなスケトウダラ urgent increase がChina's aquatic products import を新たな高みへと気上げる
The equipment investment and demand for raw materials are increasing rapidly, and the main processing points are rising. The overall price is rising, and the background is recording the intake volume and traction.
There is a large-scale influx of fishery products into the market, and China 's export volume of 279 million meters of fishery products in April 2026 is 146,519 .フードワールド (Beijing)が报じたMarket データによると、Jutsujian Naneneed により, the average input price of frozen raw materials is 1.87 meters, and the price is rising. Frozen のアラスカproduced スケトウダラが cited き続きtake lead の spindle holder っており, 総 load capacity のうち139,897 The company recorded a record of 261 million meters of ドルをand monthly input volume of 95%.
The raw material of ロシアがサプライチェーンを is controlled
The structure is extracted, the processing is done, the limbs are selected, and the head is removed ( H&G ). The raw materials are still large and the parts are biased. Yun 込まれた139,897トンのfrozen アラスカproduced スケトウダラのうち、ロシアが姧偪リーダーとして上し、253,000,000 meters of water are equivalent to 135,632 meters of water supply. The supplying country is controlled by the company, and the raw material company accounts for 96.9% of the total.
According to the application, the U.S. 5.54 million meter equivalent 5,989 meter is provided, and the Korean one is sent 908 meter . The industry's exclusive family, Korea 's debut, the majority of the quantity, re-exported, and the composition through logistics.と pointed out し, the world's のスケトウダラ supply がstill としてロシアと米国の间に强に综合されていることをripay けている.
Processing of fish and fish meat
The quantity of raw fish is controlled by one party, and the processing is determined by the market's instructions.
-
Fish のフィレ: The input amount is 4,952 トン( 13.05 million meters ) に达し,ロシアが4,141 トン( 83.6%)をSupply, the United Statesが456 Tonko provides. The average price is 1キログラムあたり2.64mドルに达した.
-
Fish meat: The shipping volume is 1,670 tons ( 5.07 million meters ) of fish, Haikou 923 fish , and Miguo 456 fish . The average price is 1キログラムあたり3.04 meters and the price is very high.
価値のINSIGHT:データは, aquatic products の origin に応じて sharp irritation な価格格色がexistent することを明らかにしている. In April , the product quality of the products produced in Japan and the United States was average. 1キログラムあたり2.45mドルとなり、ロシアのmeanである1キログラムあたり1.89mドルをlast chapterったが、One side Korea 's passed productは1キログラムあたり1.33mドルでslowdownした.
Shandong Province's aquatic products processing industry
The side of the region and the main function of aquatic products processing in Shandong are the entry and exit of the entrance. In the same province, 93,576 トンのスケトウダラ products are imported equivalent to 169 million meters , and more than 63% of the national quantity is secured. Liaoning 's 51,832 トン( 190 million meter ドル) close に続き, Jilin 's 51,056 トン( 105 million meter ドル) holding ち込んだ.
In Shandong Province , most of the processed products are absorbed, and 4,093 products ( 82.7% of the national total ) are processed. One side is Liaoning 's 561 Tong , and Shanghai 's 191 Tong is input. Special fish and meat products from Liaoning Province 1,405 トンを84% of the national market is guaranteed by シェアを advocated by し, Shandong , Jiangsu , Shanghai , and そしてBeijingには a small amount of を residual すのみとなった.
Bonded Logistics Maintenance
Customs clearance, logistics processing, and customs clearance. The bonded circulation is still good, the "bonded supervision and management place of entry and exit items" is 76,787 items , and the national import rate is 52.4%.
There are 43,046 items of processing trade and 26,136 items of logistics items in the special customs supervision and administration area . One side, general trade ルートはわずか2,162 トン, input amount 5.69 million meters ドルにとどまり, このseveral million ドThe large-scale marine products industry is a large-scale fishery trading company.
🇨🇳 Simplified Chinese
A surge in global pollock prices is driving China's seafood imports to new heights.
A surge in raw material demand, coupled with rising prices in major processing centers, has fueled record-high trade volumes.
A surge in seafood imports led China to import 146,519 tonnes of Alaska pollock products in April 2026 , valued at $279 million . According to market data reported by Food World (Beijing) , persistently strong demand has driven the average import price of frozen ingredients to $1.87 per kilogram . Frozen Alaska pollock continued to anchor the overall trade, accounting for 139,897 tonnes and $261 million of total shipments , recording an impressive 95% share of monthly imports.
Russia dominates the raw material supply chain
The trade structure remains heavily skewed towards headed and gutted ( H&G ) feedstock rather than processed options. Of the 139,897 tonnes of frozen Alaskan pollock imported , Russia is the undisputed leader, supplying 135,632 tonnes worth $253 million . This single-supplier monopoly accounts for 96.9% of the entire feedstock category .
In comparison, the United States supplied 5,989 tons worth $5.54 million , while South Korea contributed 908 tons . Industry experts point out that although South Korea appears in the data, its volume largely consists of transshipments and transit shipments, confirming that global pollock supply remains tightly concentrated between Russia and the United States .
Processed fish fillets and fish meat are sold at a premium.
Although raw fish dominate in terms of quantity, the processing sector commands significantly higher prices in the market.
-
Fish fillets: Total imports reached 4,952 tons ( $13.05 million ), of which Russia supplied 4,141 tons ( 83.6% ) and the United States supplied 456 tons . The average price reached $2.64 per kilogram .
-
Fish meat: Total shipments amounted to 1,670 tons ( $5.07 million ), with Russia contributing 923 tons and the United States contributing 456 tons . The average price surged to $3.04 per kilogram .
Value Insight: Data shows that there are significant price differences depending on the origin of seafood. In April , premium U.S. pollock products averaged $2.45 per kilogram , surpassing the Russian average of $1.89 per kilogram , while South Korean transit products stagnated at $1.33 per kilogram .
Shandong Province consolidates its position as a seafood processing center
Regionally, Shandong continued to be the main gateway for seafood processing. The province imported 93,576 tonnes of pollock products worth US$169 million, accounting for more than 63% of the national total . Liaoning followed closely with 51,832 tonnes ( $109 million ), while Jilin imported 51,056 tonnes ( $105 million ).
Shandong also absorbed the vast majority of processed fish fillets, handling 4,093 tons ( 82.7% of the national total ), while Liaoning received 561 tons and Shanghai imported 191 tons . However, Liaoning reversed this trend in specialized fish products, capturing 1,405 tons and claiming 84% of the national market share, leaving only a small amount for Shandong , Jiangsu , Shanghai , and Beijing .
Bonded logistics maintains the operation of the supply chain.
Customs data shows that logistics and processing frameworks determine how these goods enter the country. Bonded transit remains the preferred route, with "goods entering and leaving bonded supervision areas" reaching 76,787 tons , accounting for 52.4% of the country's total imports .
Traditional processing trade accounted for 43,046 tons , while logistics goods in special customs supervision zones comprised 26,136 tons . Meanwhile, general trade channels accounted for a mere 2,162 tons , with an import value of US$5.69 million , highlighting how heavily this multi-million dollar seafood pipeline relies on specialized trading zones.
[email protected]
www.seafood.media
|
|





 Print
Print